modelPBand

Information
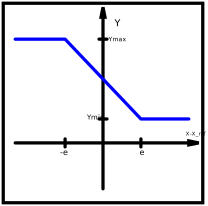
Proportional band management around a setpoint value.
Hypothesis and equations
It returns a value that varies proportionally with the difference X - X_ref (setpoint). The signal is saturated at Ymin and Ymax in extreme conditions.
Bibliography
none
Instruction for use
The model setup is:
- Ymin et Ymax, saturation values (eg. 0 and 1 to obtain a gain).
- Value of the Range, i.e. half bandwidth size
Note : For Range > 0, the proportional band will be decreasing. For an increasing function, all you need is Range < 0, leaving other values unchanged.
Known limits / Use precautions
none
Validations
Validated model
--------------------------------------------------------------
Licensed by EDF under a 3-clause BSD-license
Copyright © EDF 2009 - 2023
BuildSysPro version 3.6.0
Author : EDF
--------------------------------------------------------------
Parameters
| Type | Name | Default | Description |
|---|---|---|---|
| Real | Ymin | 0.3 | Minimum value of the output parameter |
| Real | Ymax | 1 | Maximum value of the output parameter |
| Real | Range | 0.5 | Maximum difference (X-X_ref) before output saturation |
Connectors
| Type | Name | Default | Description |
|---|---|---|---|
| Modelica.Blocks.Interfaces.RealInput | X | ||
| Modelica.Blocks.Interfaces.RealInput | X_ref | ||
| Modelica.Blocks.Interfaces.RealOutput | Y |