functionpolesAndZeros
Plot poles and/or the zeros of a transfer function
Extends from Modelica_LinearSystems2.Internal.PartialPlotFunction (Interface of a plot function).
Information
Syntax
TransferFunction.Plot.polesAndZeros(tf);
   or
TransferFunction.Plot.polesAndZeros(
  tf,
  poles=true,
  zeros=true,
  plot=true,
  defaultDiagram=Modelica_LinearSystems2.Internal.DefaultDiagramPolesAndZeros(),
  device=Modelica_LinearSystems2.Utilities.Plot.Records.Device());
Description
This function plots a pole-zero-map of the poles and zeros of a transfer function. The Boolean inputs "poles" and "zeros" define what to plot. If Boolean input "plot = true", the pole-zero-map is plotted. If false, only the diagram is generated and returned as output argument. The records "defaultDiagram" and "device" allow to set various layout options and the size and location of the diagram on the screen.
Example
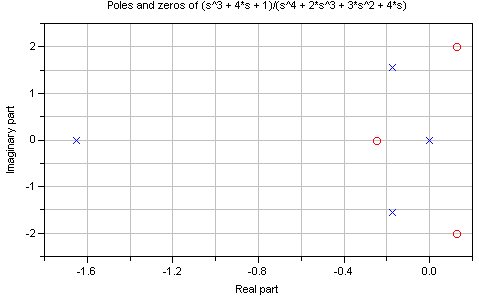
The example Modelica_LinearSystems2.Examples.TransferFunction.plotPolesAndZeros defines two transfer functions. The second one is defined as:
TransferFunction s   = TransferFunction.s();
TransferFunction tf2 = (s^3 + 4*s + 1)/(s^4 + 2*s^3 + 3*s^2 + 4*s);

Modelica_LinearSystems2.TransferFunction.Plot.polesAndZeros(
  tf=tf2,
  defaultDiagram=Modelica_LinearSystems2.Internal.DefaultDiagramPolesAndZeros(
    heading="Poles and zeros of " + String(tf2)));
and results in
Inputs
| Type | Name | Default | Description |
|---|---|---|---|
| TransferFunction | tf | Linear system in transfer function form | |
| Boolean | poles | true | = true, to plot the poles of tf |
| Boolean | zeros | true | = true, to plot the zeros of tf |
| Plot.Records.Diagram | defaultDiagram (from PartialPlotFunction) | Default diagram layout | |
| Plot.Records.Device | device (from PartialPlotFunction) | Modelica_LinearSystems2.Utilities.Plot.Records.Device() | Properties of device where figure is shown |