functionplotParameterizedCurve1
Plot two circles as parameterized curve
Information
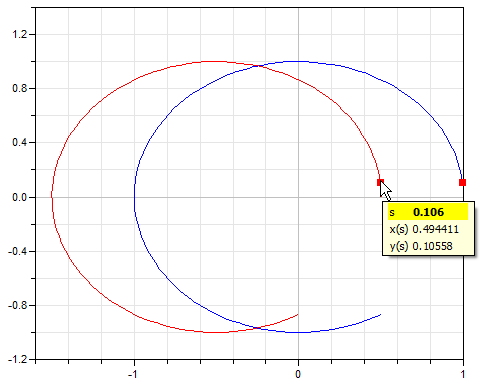
This function plots the following parameterized cuves diagram (with default input arguments; the menu on the right part is displayed when moving the cursor on one curve point; then all points belonging to the same path parameter value are marked with a red square):
Inputs
| Type | Name | Default | Description |
|---|---|---|---|
| Modelica.Units.NonSI.Angle_deg | maxAngle | 300 | Maximum opening angle |
| Integer | nPoints | 100 | Number of points |