functionrootLocusOfModel
Compute and plot the root locus of one parameter of a model (= eigen values of the model that is linearized for every parameter value)
Information
Syntax
Plot.rootLocusOfModel(modelName, modelParam, simulationSetup, diagram, device)
Description
This function computes and plots a root locus of a selected Modelica model by varying one parameter and performing an eigen value analysis for every parameter value. Other parameters of the model can be set to a specific value. An equidistant or a logarithmic gridding of the parameter to be varied can be selected and then the gridding is performed between the given minimum and maximum value.
Example
Calling the function
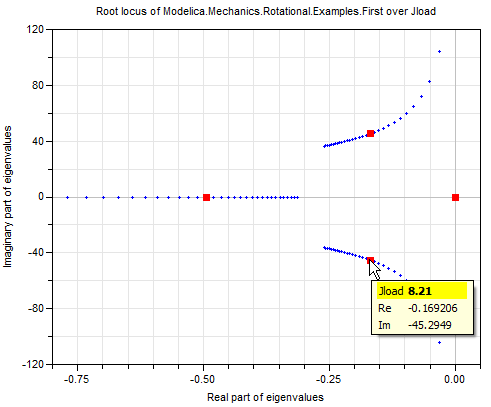
Utilities.Plot.rootLocusOfModel(
  modelName = "Modelica.Mechanics.Rotational.Examples.First",
  modelParam={
    Modelica_LinearSystems2.Records.ParameterVariation(
      Name="Jload",
      grid=Modelica_LinearSystems2.Types.Grid.Logarithmic
      Min=1,
      Max=6,
      nPoints=101)});
yields the following diagram (the menu on the right lower part is displayed when moving the cursor on one curve point; then all points belonging to the same parameter value are marked with a red square):
Inputs
| Type | Name | Default | Description |
|---|---|---|---|
| String | modelName | Name of the Modelica model | |
| Modelica_LinearSystems2.Records.ParameterVariation[:] | modelParam | Model parameter to be varied (exactly one) and values for other parameters | |
| Modelica_LinearSystems2.Records.SimulationOptionsForLinearization | simulationSetup | Modelica_LinearSystems2.Records.SimulationOptionsForLinearization() | Simulation options |
| Modelica_LinearSystems2.Utilities.Plot.Records.RootLocusDiagram | diagram | Modelica_LinearSystems2.Utilities.Plot.Records.RootLocusDiagram() | |
| Modelica_LinearSystems2.Utilities.Plot.Records.Device | device | Modelica_LinearSystems2.Utilities.Plot.Records.Device() | Properties of device where figure is shown |