functionbodeSISO
Plot bode plot of the corresponding discrete transfer function
Extends from Modelica_LinearSystems2.Internal.PartialPlotFunction (Interface of a plot function).
Information
Syntax
StateSpace.Plot.plotBodeSISO(ss)
   or
StateSpace.Plot.plotBodeSISO(ss, iu, iy, nPoints, autoRange, f_min, f_max, magnitude=true, phase=true, defaultDiagram=Modelica_LinearSystems2.Internal.DefaultDiagramBodePlot(), device=Modelica_LinearSystems2.Utilities.Plot.Records.Device() )
Description
Plots the bode-diagram of a transfer function.
Description
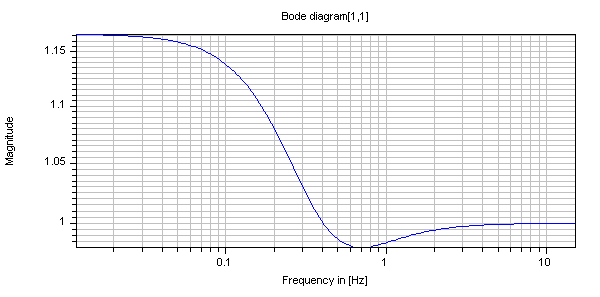
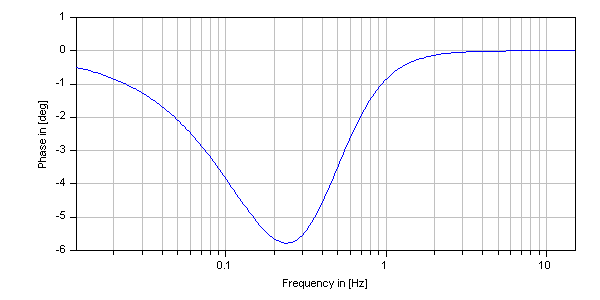
Function plotBodeSISO plots a bode-diagram of the transfer function corresponding to the behavior of the state space system from iu'th element of the input vector u to the iy'th element of the output vector y.
Example
  Modelica_LinearSystems2.StateSpace ss=Modelica_LinearSystems2.StateSpace(
    A=[-1.0,0.0,0.0; 0.0,-2.0,0.0; 0.0,0.0,-3.0],
    B=[0.0,1.0; 1.0,1.0; -1.0,0.0],
    C=[0.0,1.0,1.0; 1.0,1.0,1.0],
    D=[1.0,0.0; 0.0,1.0])

  Integer iu=1;
  Integer iy=1;

algorithm
  Modelica_LinearSystems2.StateSpace.Plot.plotBodeSISO(ss, iu, iy)
//  gives:
Inputs
| Type | Name | Default | Description |
|---|---|---|---|
| DiscreteStateSpace | dss | discrete state space system | |
| Integer | iu | 1 | index of input |
| Integer | iy | 1 | index of output |
| Integer | nPoints | 200 | Number of points |
| Boolean | autoRange | true | True, if abszissa range is automatically determined |
| Modelica.Units.SI.Frequency | f_min | 0.1 | Minimum frequency value, if autoRange = false |
| Modelica.Units.SI.Frequency | f_max | 10 | Maximum frequency value, if autoRange = false |
| Boolean | magnitude | true | = true, to plot the magnitude of dtf |
| Boolean | phase | true | = true, to plot the pase of tf |
| Plot.Records.Diagram | defaultDiagram (from PartialPlotFunction) | Default diagram layout | |
| Plot.Records.Device | device (from PartialPlotFunction) | Modelica_LinearSystems2.Utilities.Plot.Records.Device() | Properties of device where figure is shown |