functionbode
Plot transfer function as bode plot
Extends from Modelica_LinearSystems2.Internal.PartialPlotFunction (Interface of a plot function).
Information
Syntax
TransferFunction.Plot.plotBode(dtf)
   or
TransferFunction.Plot.plotBode(dtf, nPoints, autoRange, f_min, f_max, magnitude=true, phase=true, defaultDiagram=Modelica_LinearSystems2.Internal.DefaultDiagramBodePlot(), device=Modelica_LinearSystems2.Utilities.Plot.Records.Device() )
Description
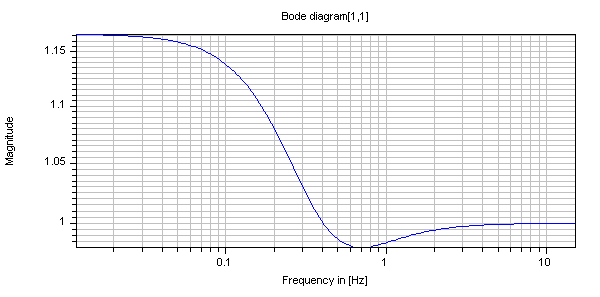
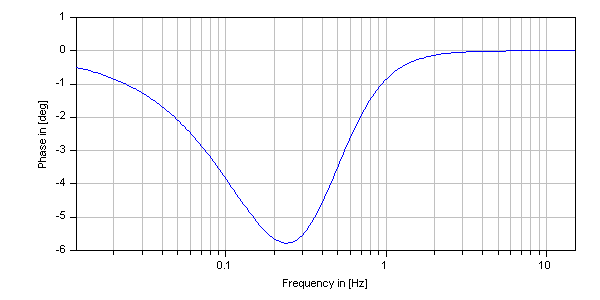
This function plots the bode-diagram of a transfer function.
Example
  TransferFunction s = Modelica_LinearSystems2.TransferFunction.s();
  Modelica_LinearSystems2.TransferFunction tf =(s^2 + 5*s + 7)/(s^2 + 5*s + 6);

algorithm
  Modelica_LinearSystems2.TransferFunction.Plot.plotBode(tf)
//  gives:
Inputs
| Type | Name | Default | Description |
|---|---|---|---|
| DiscreteTransferFunction | dtf | DiscreteTransfer function to be plotted | |
| Integer | nPoints | 200 | Number of points |
| Boolean | autoRange | true | True, if abszissa range is automatically determined |
| SI.Frequency | f_min | 0.1 | Minimum frequency value, if autoRange = false |
| SI.Frequency | f_max | 10 | Maximum frequency value, if autoRange = false |
| Boolean | magnitude | true | = true, to plot the magnitude of tf |
| Boolean | phase | true | = true, to plot the pase of tf |
| Plot.Records.Diagram | defaultDiagram (from PartialPlotFunction) | Default diagram layout | |
| Plot.Records.Device | device (from PartialPlotFunction) | Modelica_LinearSystems2.Utilities.Plot.Records.Device() | Properties of device where figure is shown |