
modelTestLeadMOrderLag
Extends from Modelica.Icons.Example (Icon for runnable examples).
Information
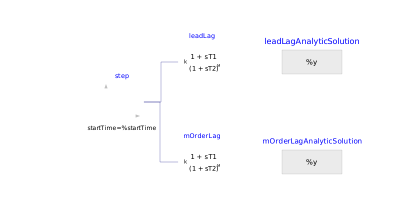
This model demonstrates the correct behaviour of the LeadMOrderLag filter in two cases, by comparing its ouptut to the analytical response.The first case is a simple lead-lag filter with k = 10, T1 = 4, T2 = 2 and M = 1.
The second case is a filter with k = 1, T1 = 1e-5 (very small, practically zero), T2 = 1/100 and N = 100, which is the (0,100) Padé approximation of a pure time delay of 1 second.
Components
| Type | Name | Default | Description |
|---|---|---|---|
| PowerGrids.Controls.LeadMOrderLag | leadLag | ||
| Modelica.Blocks.Sources.Step | step | ||
| Modelica.Blocks.Sources.RealExpression | leadLagAnalyticSolution | ||
| PowerGrids.Controls.LeadMOrderLag | mOrderLag | ||
| Modelica.Blocks.Sources.RealExpression | mOrderLagAnalyticSolution |