modelWeeklyHeatProfile
Normalized typical daily load profile is applied to input heat demand
Extends from Basics.Icons.Block.
Information
DailyHeatProfile
1. General Description
The profile ist taken from
[1] H. Gadd and S. Werner, “Heat load patterns in district heating substations,” Appl. Energy, vol. 108, pp. 176–183, 2013.
... scaled to its mean value and multiplied to the input profile such that the energy consumption (in MWh) is conserved.
See: TransiEnt.Distribution.Heat.HeatGridControl.Check.TestDailyHeatProfile for how this work
Only the profile for December - February has been taken. TODO: Digitize all others from Figure 1 and apply accordingly
Parameters
| Type | Name | Default | Description |
|---|---|---|---|
| SI.Time | t_start_week | 6*86400 | Time between simulation start and first monday (e.g. first day is a sunday) |
| SI.Time | t_hp_end | 12441600 | End of heating period in Hamburg in 2012 according to http://ecowetter.de/ort/heizgradtage/hamburg/2012.html |
| SI.Time | t_hp_start | 22982400 | End of heating period in Hamburg in 2012 according to http://ecowetter.de/ort/heizgradtage/hamburg/2012.html |
Connectors
| Type | Name | Default | Description |
|---|---|---|---|
| TransiEnt.Basics.Interfaces.Thermal.HeatFlowRateIn | Q_flow_raw | Heat flow rate input | |
| TransiEnt.Basics.Interfaces.Thermal.HeatFlowRateOut | Q_flow | Heat flow rate output |
Components
| Type | Name | Default | Description |
|---|---|---|---|
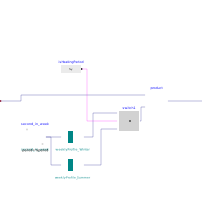
| Basics.Tables.GenericCombiTable1Ds | weeklyProfile_Winter | H. Gadd and S. Werner, 'Heat load patterns in district heating substations,' Appl. Energy, vol. 108, pp. 176–183, 2013. | |
| Basics.Blocks.Sources.SawTooth | second_in_week | ||
| Modelica.Blocks.Math.Product | product | ||
| Basics.Tables.GenericCombiTable1Ds | weeklyProfile_Summer | H. Gadd and S. Werner, 'Heat load patterns in district heating substations,' Appl. Energy, vol. 108, pp. 176–183, 2013. | |
| Modelica.Blocks.Logical.Switch | switch1 | ||
| Modelica.Blocks.Sources.BooleanExpression | isHeatingPeriod |