OMEdit – OpenModelica Connection Editor
OMEdit – OpenModelica Connection Editor is the new Graphical User Interface for graphical model editing in OpenModelica. It is implemented in C++ using the Qt 4.8 graphical user interface library and supports the Modelica Standard Library version 3.1 that is included in the latest OpenModelica installation. This chapter gives a brief introduction to OMEdit and also demonstrates how to create a DCMotor model using the editor.
OMEdit provides several user friendly features for creating, browsing, editing, and simulating models:
Modeling – Easy model creation for Modelica models.
- Pre-defined models – Browsing the Modelica Standard library to
access the provided models.
- User defined models – Users can create their own models for
immediate usage and later reuse.
- Component interfaces – Smart connection editing for drawing and
editing connections between model interfaces.
- Simulation – Subsystem for running simulations and specifying
simulation parameters start and stop time, etc.
Plotting – Interface to plot variables from simulated models.
Starting OMEdit
A splash screen similar to the one shown in Figure 5 will appear indicating that it is starting OMEdit. The executable is found in different places depending on the platform (see below).
Figure 5 OMEdit Splash Screen.
Microsoft Windows
OMEdit can be launched using the executable placed in OpenModelicaInstallationDirectory/bin/OMEdit/OMEdit.exe. Alternately, choose OpenModelica > OpenModelica Connection Editor from the start menu in Windows.
Linux
Start OMEdit by either selecting the corresponding menu application item or typing “OMEdit” at the shell or command prompt.
Mac OS X
The default installation is /Application/MacPorts/OMEdit.app.
MainWindow & Browsers
The MainWindow contains several dockable browsers,
- Search Browser
- Libraries Browser
- Documentation Browser
- Variables Browser
- Messages Browser
Figure 6 shows the MainWindow and browsers.
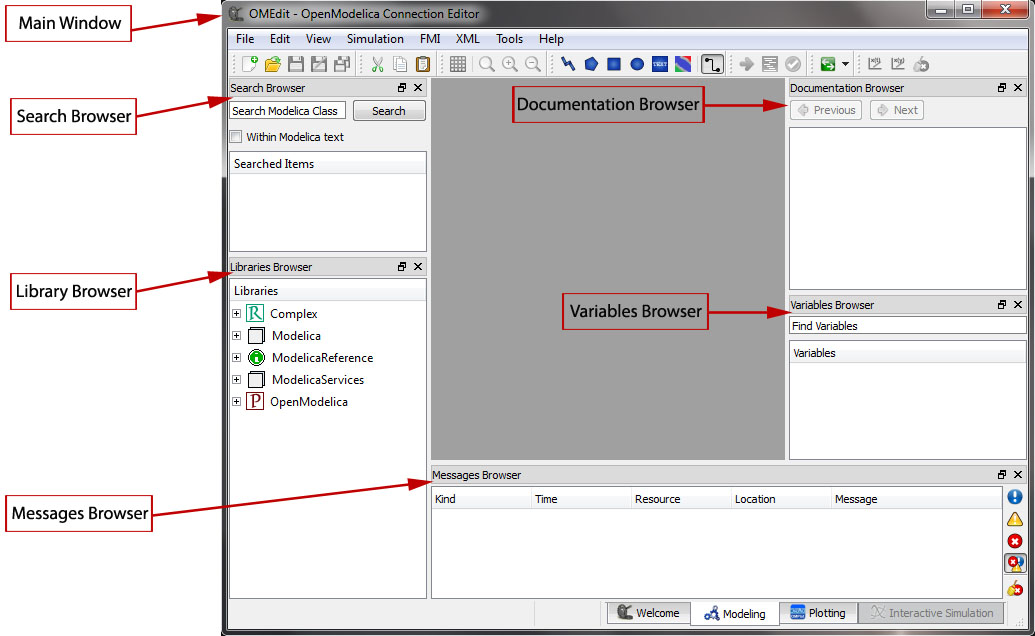
Figure 6 OMEdit MainWindow and Browsers.
The default location of the browsers are shown in Figure 6. All browsers except for Message Browser can be docked into left or right column. The Messages Browser can be docked into left,right or bottom areas. If you want OMEdit to remember the new docked position of the browsers then you must enable Preserve User’s GUI Customizations option, see section General.
Search Browser
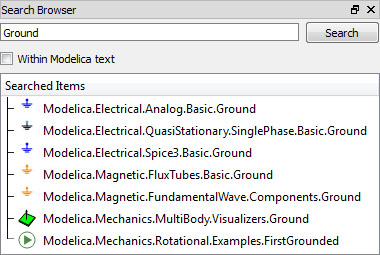
Figure 7 Search Browser.
To view the Search Browser click Edit->Search Browser or press keyboard shortcut Ctrl+Shift+F. The loaded Modelica classes can be searched by typing any part of the class name. It is also possible to search the Modelica class if one knows the text string that is used within it but Within Modelica text checkbox should be checked for this feature to work.
Libraries Browser
To view the Libraries Browser click View->Windows->Libraries Browser. Shows the list of loaded Modelica classes. Each item of the Libraries Browser has right click menu for easy manipulation and usage of the class. The classes are shown in a tree structure with name and icon. The protected classes are not shown by default. If you want to see the protected classes then you must enable the Show Protected Classes option, see section General.
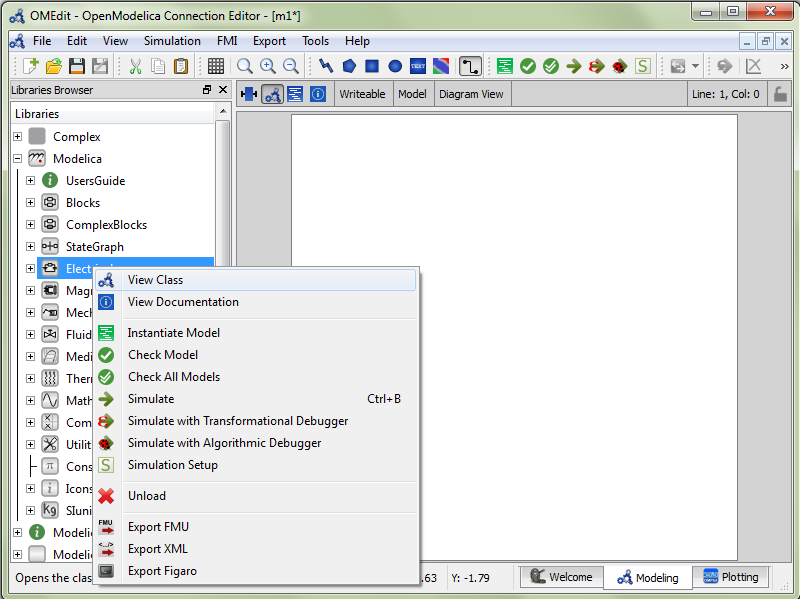
Figure 8 Libraries Browser.
Documentation Browser
Displays the HTML documentation of Modelica classes. It contains the navigation buttons for moving forward and backward. To see documentation of any class, right click the Modelica class in Libraries Browser and choose View Documentation.
Figure 9 Documentation Browser.
Variables Browser
The class variables are structured in the form of the tree and are displayed in the Variables Browser. Each variable has a checkbox. Ticking the checkbox will plot the variable values. There is a find box on the top for filtering the variable in the tree. The filtering can be done using Regular Expression, Wildcard and Fixed String. The complete Variables Browser can be collapsed and expanded using the Collapse All and Expand All buttons.
The browser allows manipulation of changeable parameters for Re-simulating a Model. It also displays the unit and description of the variable.
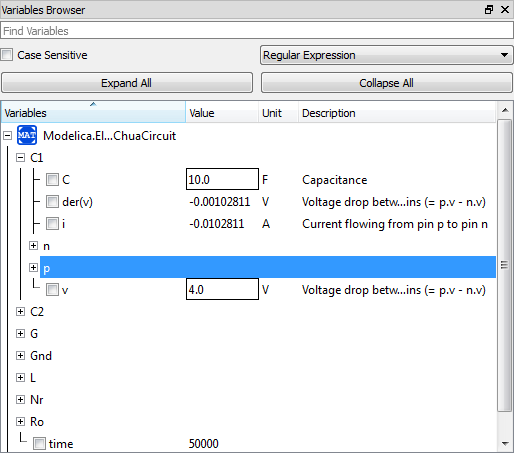
Figure 10 Variables Browser.
Perspectives
The perspective tabs are loacted at the bottom right of the MainWindow:
- Welcome Perspective
- Modeling Perspective
- Plotting Perspective
Welcome Perspective
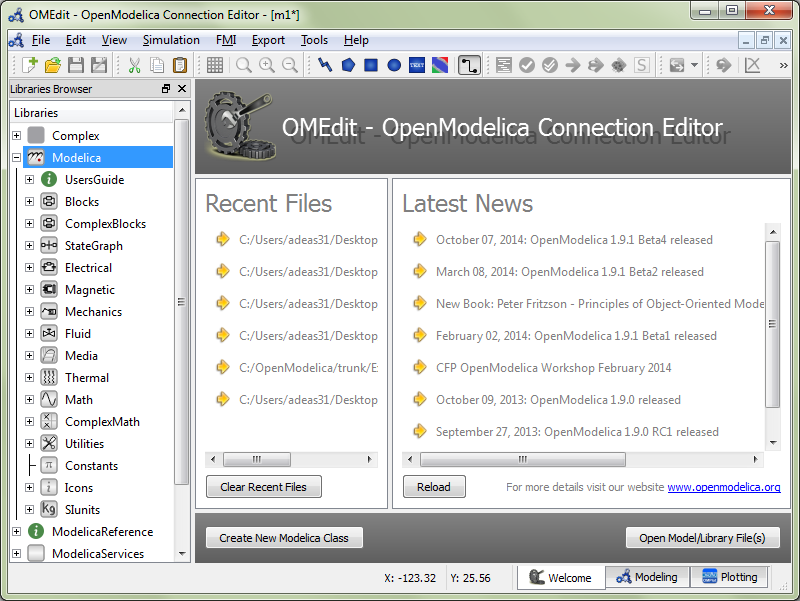
Figure 11 OMEdit Welcome Perspective.
The Welcome Perspective shows the list of recent files and the list of latest news from https://www.openmodelica.org/. See Figure 11. The orientation of recent files and latest news can be horizontal or vertical. User is allowed to show/hide the latest news. See section General.
Modeling Perspective
The Modeling Perpective provides the interface where user can create and design their models. See Figure 12.
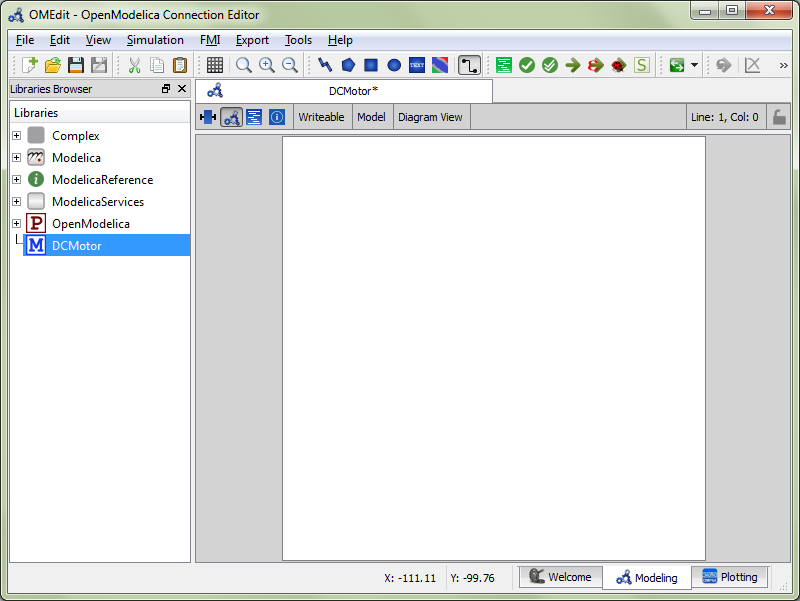
Figure 12 OMEdit Modeling Perspective.
The Modeling Perspective interface can be viewed in two different modes, the tabbed view and subwindow view, see section General.
Plotting Perspective
The Plotting Perspective shows the simulation results of the models. Plotting Perspective will automatically become active when the simulation of the model is finished successfully. It will also become active when user opens any of the OpenModelica’s supported result file. Similar to Modeling Perspective this perspective can also be viewed in two different modes, the tabbed view and subwindow view, see section General.
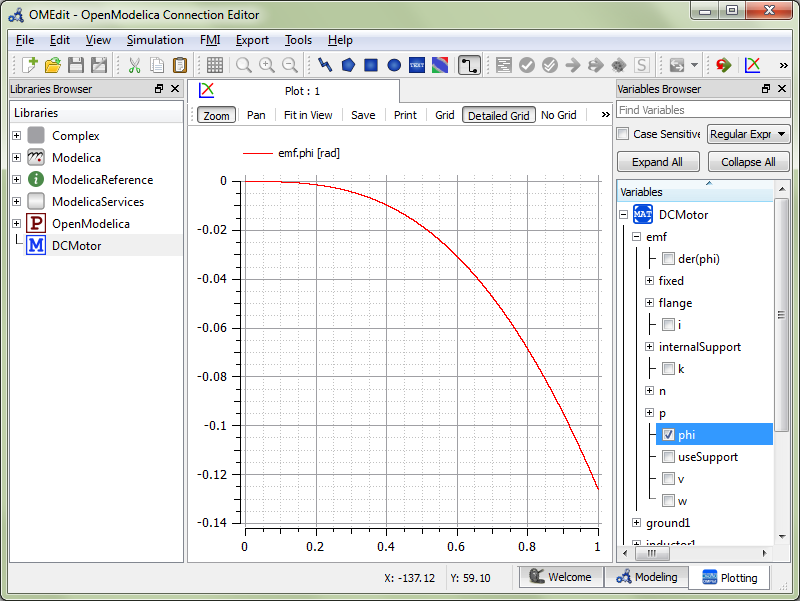
Figure 13 OMEdit Plotting Perspective.
Modeling a Model
Creating a New Modelica class
Creating a new Modelica class in OMEdit is rather straightforward. Choose any of the following methods,
Select File > New Modelica Class from the menu.
Click on New Modelica Class toolbar button.
- Click on the Create New Modelica Class button available at the left
bottom of Welcome Perspective.
Press Ctrl+N.
Opening a Modelica File
Choose any of the following methods to open a Modelica file,
Select File > Open Model/Library File(s) from the menu.
Click on Open Model/Library File(s) toolbar button.
- Click on the Open Model/Library File(s) button available at the right
bottom of Welcome Perspective.
Press Ctrl+O.
Opening a Modelica File with Encoding
Select File > Open/Convert Modelica File(s) With Encoding from the menu. It is also possible to convert files to UTF-8.
Model Widget
For each Modelica class one Model Widget is created. It has a statusbar and a view area. The statusbar contains buttons for navigation between the views and labels for information. The view area is used to display the icon, diagram and text layers of Modelica class. See Figure 14.
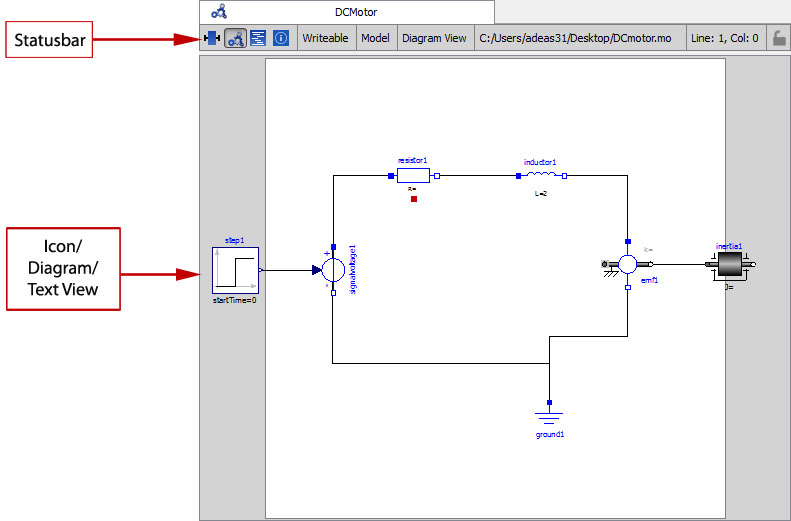
Figure 14 Model Widget showing the Diagram View.
Adding Component Models
Drag the models from the Libraries Browser and drop them on either Diagram or Icon View of Model Widget.

Simulating a Model
The OMEdit Simulation Dialog can be launched by,
- Selecting Simulation > Simulation Setup from the menu. (requires a
model to be active in ModelWidget)
- Clicking on the Simulation Setup toolbar button. (requires a model to
be active in ModelWidget)
- Right clicking the model from the Libraries Browser and choosing
Simulation Setup.
General Tab
Start Time – the simulation start time.
Stop Time – the simulation stop time.
Method – the simulation solver. See Appendix C for solver details.
Tolerance – the simulation tolerance.
Compiler Flags (Optional) – the optional C compiler flags.
- Number of Processors – the number of processors used to build the
simulation.
- Launch Transformational Debugger – launches the transformational
debugger.
Launch Algorithmic Debugger – launches the algorithmic debugger.
Output Tab
- Number of Intervals – the simulation number of intervals.
- Output Format – the simulation result file output format.
- File Name (Optional) – the simulation result file name.
- Variable Filter (Optional).
- Protected Variables – adds the protected variables in result file.
- Store Variables at Events – adds the variables at time events.
- Show Generated File – displays the generated files in a dialog box.
Simulation Flags Tab
- Model Setup File (Optional) – specifies a new setup XML file to the
generated simulation code.
- Initialization Method (Optional) – specifies the initialization
method.
- Equation System Initialization File (Optional) – specifies an
external file for the initialization of the model.
- Equation System Initialization Time (Optional) – specifies a time
for the initialization of the model.
Clock (Optional) – the type of clock to use.
Linear Solver (Optional) – specifies the linear solver method.
Non Linear Solver (Optional) – specifies the nonlinear solver.
- Linearization Time (Optional) – specifies a time where the
linearization of the model should be performed.
- Output Variables (Optional) – outputs the variables a, b and c at
the end of the simulation to the standard output.
Profiling – creates a profiling HTML file.
CPU Time – dumps the cpu-time into the result file.
Enable All Warnings – outputs all warnings.
Logging (Optional)
DASSL Solver Information – prints additional information about dassl solver.
Debug – prints additional debug information.
Dynamic State Selection Information – outputs information about dynamic state selection.
Jacobians Dynamic State Selection Information – outputs jacobain of the dynamic state selection.
Event Iteration – additional information during event iteration.
Verbose Event System – verbose logging of event system.
Initialization – prints additional information during initialization.
Jacobians Matrix – outputs the jacobian matrix used by dassl.
Non Linear Systems – logging for nonlinear systems.
Verbose Non Linear Systems – verbose logging of nonlinear systems.
Jacobians Non Linear Systems – outputs the jacobian of nonlinear systems.
Initialization Residuals – outputs residuals of the initialization.
Simulation Process – additional information about simulation process.
Solver Process – additional information about solver process.
Final Initialization Solution – final solution of the initialization.
Timer/Event/Solver Statistics – additional statistics about timer/events/solver.
Util.
Zero Crossings – additional information about the zerocrossings.
- Additional Simulation Flags (Optional) – specify any other
simulation flag.
Plotting the Simulation Results
Successful simulation of model produces the result file which contains the instance variables that are candidate for plotting. Variables Browser will show the list of such instance variables. Each variable has a checkbox, checking it will plot the variable. See Figure 13.
Types of Plotting
The plotting type depends on the active Plot Window. By default the plotting type is Time Plot.


Re-simulating a Model
The Variables Browser allows manipulation of changeable parameters for re-simulation. After changing the parameter values user can click on the re-simulate toolbar button, or right click the model in Variables Browser and choose re-simulate from the menu.

Figure 18 Re-simulate toolbar button.
How to Create User Defined Shapes – Icons
Users can create shapes of their own by using the shape creation tools available in OMEdit.
- Line Tool – Draws a line. A line is created with a minimum of two
points. In order to create a line, the user first selects the line tool from the toolbar and then click on the Icon/Diagram View; this will start creating a line. If a user clicks again on the Icon/Diagram View a new line point is created. In order to finish the line creation, user has to double click on the Icon/Diagram View.
- Polygon Tool – Draws a polygon. A polygon is created in a similar
fashion as a line is created. The only difference between a line and a polygon is that, if a polygon contains two points it will look like a line and if a polygon contains more than two points it will become a closed polygon shape.
- Rectangle Tool – Draws a rectangle. The rectangle only contains two
points where first point indicates the starting point and the second point indicates the ending the point. In order to create rectangle, the user has to select the rectangle tool from the toolbar and then click on the Icon/Diagram View, this click will become the first point of rectangle. In order to finish the rectangle creation, the user has to click again on the Icon/Diagram View where he/she wants to finish the rectangle. The second click will become the second point of rectangle.
- Ellipse Tool – Draws an ellipse. The ellipse is created in a
similar way as a rectangle is created.
Text Tool – Draws a text label.
Bitmap Tool – Draws a bitmap container.
The shape tools are located in the toolbar. See Figure 19.
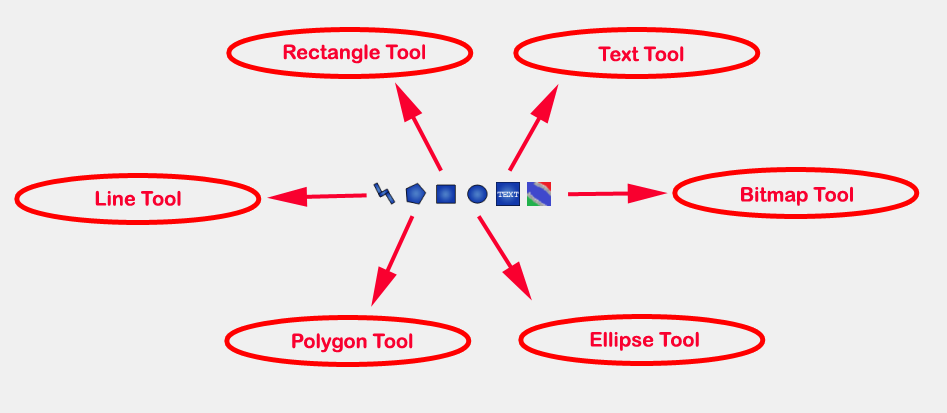
Figure 19 User defined shapes.
The user can select any of the shape tools and start drawing on the Icon/Diagram View. The shapes created on the Diagram View of Model Widget are part of the diagram and the shapes created on the Icon View will become the icon representation of the model.
For example, if a user creates a model with name testModel and add a rectangle using the rectangle tool and a polygon using the polygon tool, in the Icon View of the model. The model’s Modelica Text will appear as follows:
model testModel
  annotation(Icon(graphics = {Rectangle(rotation = 0, lineColor = {0,0,255}, fillColor = {0,0,255}, pattern = LinePattern.Solid, fillPattern = FillPattern.None, lineThickness = 0.25, extent = {{ -64.5,88},{63, -22.5}}),Polygon(points = {{ -47.5, -29.5},{52.5, -29.5},{4.5, -86},{ -47.5, -29.5}}, rotation = 0, lineColor = {0,0,255}, fillColor = {0,0,255}, pattern = LinePattern.Solid, fillPattern = FillPattern.None, lineThickness = 0.25)}));
end testModel;
In the above code snippet of testModel, the rectangle and a polygon are added to the icon annotation of the model. Similarly, any user defined shape drawn on a Diagram View of the model will be added to the diagram annotation of the model.
Settings
OMEdit allows users to save several settings which will be remembered across different sessions of OMEdit. The Options Dialog can be used for reading and writing the settings.
General
- General
- Language – Sets the application language.
- Working Directory – Sets the application working directory.
- Toolbar Icon Size – Sets the size for toolbar icons.
- Preserve User’s GUI Customizations – If true then OMEdit will remember its windows and toolbars positions and sizes.
- Libraries Browser
- Library Icon Size – Sets the size for library icons.
- Show Protected Classes – Sets the application language.
- Modeling View Mode
- Tabbed View/SubWindow View – Sets the view mode for modeling.
- Plotting View Mode
- Tabbed View/SubWindow View – Sets the view mode for plotting.
- Default View
- Icon View/DiagramView/Modelica Text View/Documentation View – If no preferredView annotation is defined then this setting is used to show the respective view when user double clicks on the class in the Libraries Browser.
- Enable Auto Save
- Auto Save interval – Sets the auto save interval value. The minimum possible interval value is 60 seconds.
- Enable Auto Save for single classes – Enables the auto save for one class saved in one file.
- Enable Auto Save for one file packages – Enables the auto save for packages saved in one file.
- Welcome Page
- Horizontal View/Vertical View – Sets the view mode for welcome page.
- Show Latest News – if true then displays the latest news.
Libraries
- System Libraries – The list of system libraries that should be
loaded every time OMEdit starts.
- Force loading of Modelica Standard Library – If true then Modelica
and ModelicaReference will always load even if user has removed them from the list of system libraries.
- User Libraries – The list of user libraries/files that should be
loaded every time OMEdit starts.
Modelica Text Editor
- General
- Enable Syntax Highlighting – Enable/Disable the syntax highlighting for the Modelica Text Widget.
- Enable Line Wrapping – Enable/Disable the line wrapping for the Modelica Text Widget.
- Fonts and Colors
- Font Family – Contains the names list of available fonts.
- Font Size – Sets the font size.
- Items – List of categories used of syntax highlighting the code.
- Item Color – Sets the color for the selected item.
- Preview – Shows the demo of the syntax highlighting.
Graphical Views
- Extent
- Left – Defines the left extent point for the view.
- Bottom – Defines the bottom extent point for the view.
- Right – Defines the right extent point for the view.
- Top – Defines the top extent point for the view.
- Grid
- Horizontal – Defines the horizontal size of the view grid.
- Vertical – Defines the vertical size of the view grid.
- Component
- Scale factor – Defines the initial scale factor for the component dragged on the view.
- Preserve aspect ratio – If true then the component’s aspect ratio is preserved while scaling.
Simulation
- Simulation
- Matching Algorithm – sets the matching algorithm for simulation.
- Index Reduction Method – sets the index reduction method for simulation.
- OMC Flags – sets the omc flags for simulation.
- Save class before simulation – if ture then always saves the class before running the simulation.
- Output
- Structured – Shows the simulation output in the form of tree structure.
- Formatted Text – Shows the simulation output in the form of formatted text.
Messages
- General
- Output Size - Specifies the maximum number of rows the Messages Browser may have. If there are more rows then the rows are removed from the beginning.
- Reset messages number before simulation – Resets the messages counter before starting the simulation.
- Font and Colors
- Font Family – Sets the font for the messages.
- Font Size – Sets the font size for the messages.
- Notification Color – Sets the text color for notification messages.
- Warning Color – Sets the text color for warning messages.
- Error Color – Sets the text color for error messages.
Notifications
- Notifications
- Always quit without prompt – If true then OMEdit will quit without prompting the user.
- Show item dropped on itself message – If true then a message will pop-up when a class is dragged and dropped on itself.
- Show model is defined as partial and component will be added as replaceable message – If true then a message will pop-up when a partial class is added to another class.
- Show component is declared as inner message – If true then a message will pop-up when an inner component is added to another class.
- Show save model for bitmap insertion message – If true then a message will pop-up when user tries to insert a bitmap from a local directory to an unsaved class.
Line Style
- Line Style
- Color – Sets the line color.
- Pattern – Sets the line pattern.
- Thickness – Sets the line thickness.
- Start Arrow – Sets the line start arrow.
- End Arrow – Sets the line end arrow.
- Arrow Size – Sets the start and end arrow size.
- Smooth – If true then the line is drawn as a Bezier curve.
Fill Style
- Fill Style
- Color – Sets the fill color.
- Pattern – Sets the fill pattern.
Curve Style
- Curve Style
- Pattern – Sets the curve pattern.
- Thickness – Sets the curve thickness.
Figaro
- Figaro
- Figaro Database File – the Figaro database file path.
- Figaro Mode –
- Figaro Options File – the Figaro options file path.
- Figaro Process – the Figaro process location.
Debugger
- Algorithmic Debugger
- GDB Path – the gnu debugger path
- GDB Command Timeout – timeout for gdb commands.
- Display C frames – if true then shows the C stack frames.
- Display unknown frames – if true then shows the unknown stack frames. Unknown stack frames means frames whose file path is unknown.
- Clear old output on a new run – if true then clears the output window on new run.
- Clear old log on new run – if true then clears the log window on new run.
- Transformational Debugger
- Always show Transformational Debugger after compilation – if true then always open the Transformational Debugger window after model compilation.
- Generate operations in the info xml – if true then adds the operations information in the info xml file.
FMI
- Export
- Version 1.0 – Sets the FMI export version to 1.0
- Version 2.0 – Sets the FMI export version to 2.0
The Equation-based Debugger
This section gives a short description how to get started using the equation-based debugger in OMEdit.
Enable Tracing Symbolic Transformations
This enables tracing symbolic transformations of equations. It is optional but strongly recommended in order to fully use the debugger. The compilation time overhead from having this tracing on is less than 1%, however, in addition to that, some time is needed for the system to write the xml file containing the transformation tracing information.
Enable +d=infoXmlOperations in Tools->Options->Simulation (see section Simulation) OR alternatively click on the checkbox Generate operations in the info xml in Tools->Options->Debugger (see section Debugger) which performs the same thing.
This adds all the transformations performed by OpenModelica on the equations and variables stored in the model_info.xml file. This is necessary for the debugger to be able to show the whole path from the source equation(s) to the position of the bug.
Load a Model to Debug
Load an interesting model. We will use the package Debugging.mo since it contains suitable, broken models to demonstrate common errors.
Todo
Include Debugging.mo in the test models in the distribution?
Simulate and Start the Debugger
Select and simulate the model as usual. For example, if using the Debugging package, select the model Debugging.Chattering.ChatteringEvents1. If there is an error, you will get a clickable link that starts the debugger. If the user interface is unresponsive or the running simulation uses too much processing power, click cancel simulation first.
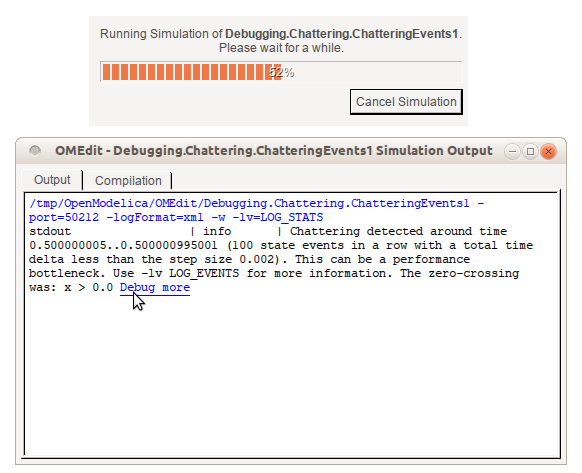
Figure 20 Simulating the model.
Use the Transformation Debugger for Browsing
Use the transformation debugger. It opens on the equation where the error was found. You can browse through the dependencies (variables that are defined by the equation, or the equation is dependent on), and similar for variables. The equations and variables form a bipartite graph that you can walk.
If the +d=infoXmlOperations was used or you clicked the “generate operations” button, the operations performed on the equations and variables can be viewed. In the example package, there are not a lot of operations because the models are small.
Try some larger models, e.g. in the MultiBody library or some other library, to see more operations with several transformation steps between different versions of the relevant equation(s). If you do not trigger any errors in a model, you can still open the debugger, using File->Open Transformations File (model_info.json).
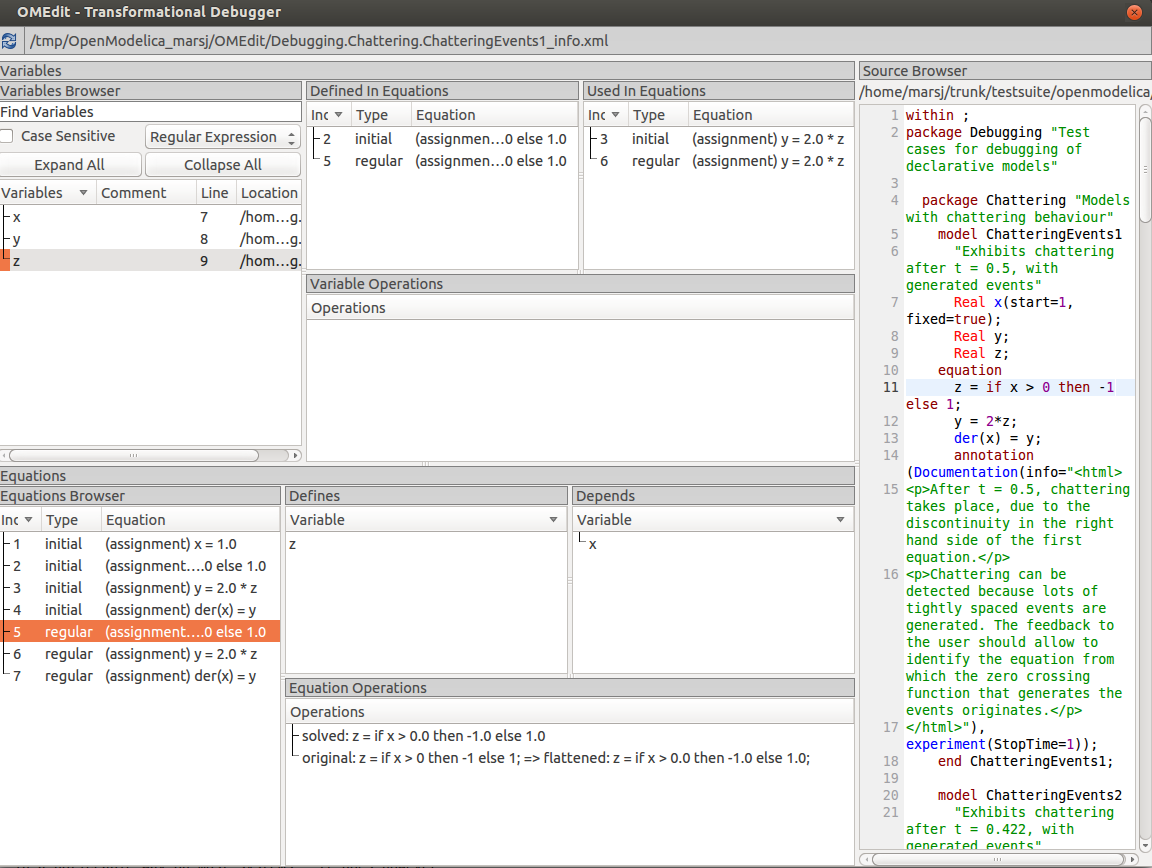
Figure 21 Transfomations Browser.
The Algorithmic Debugger
This section gives a short description how to get started using the algorithmic debugger in OMEdit. See section Simulation for further details of debugger options/settings. The Algorithmic Debugger window can be launched from Tools->Windows->Algorithmic Debugger.
Adding Breakpoints
There are two ways to add the breakpoints,
- Click directly on the line number in Text View, a red circle is
created indicating a breakpoint as shown in Figure 22.
- Open the Algorithmic Debugger window and add a breakpoint using the
right click menu of Breakpoints Browser window.
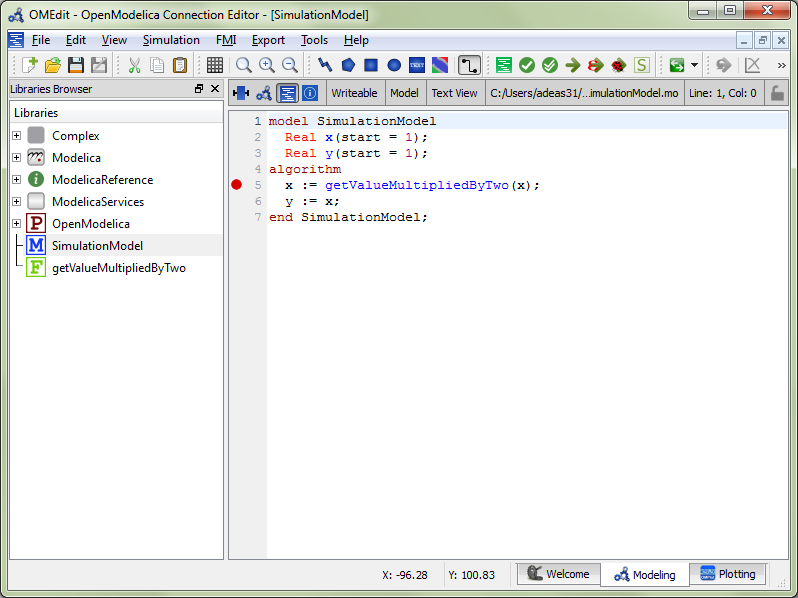
Figure 22 Adding breakpoint in Text View.
Start the Algorithmic Debugger
You should add breakpoints before starting the debugger because sometimes the simulation finishes quickly and you won’t get any chance to add the breakpoints.
There are four ways to start the debugger,
- Open the Simulation Setup and click on Launch Algorithmic Debugger
before pressing Simulate.
- Right click the model in Libraries Browser and select Simulate with
Algorithmic Debugger.
- Open the Algorithmic Debugger window and from menu select
Debug-> Debug Configurations.
- Open the Algorithmic Debugger window and from menu select
Debug-> Attach to Running Process.
Debug Configurations
If you already have a simulation executable with debugging symbols outside of OMEdit then you can use the Debug->Debug Configurations option to load it.
The debugger also supports MetaModelica data structures so one can debug omc executable. Select omc executable as program and write the name of the mos script file in Arguments.
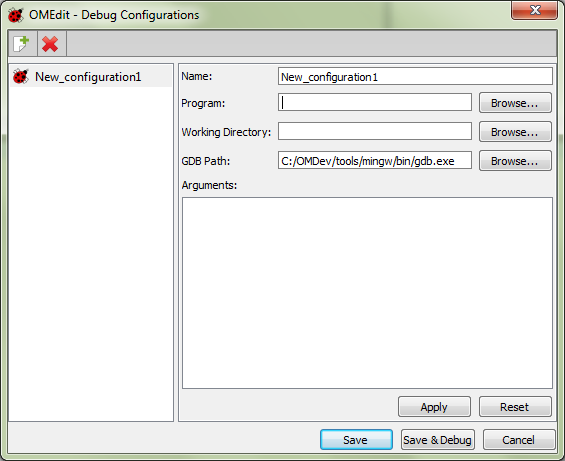
Figure 23 Debug Configurations.
Attach to Running Process
If you already have a running simulation executable with debugging symbols outside of OMEdit then you can use the Debug->Attach to Running Process option to attach the debugger with it. Figure 24 shows the Attach to Running Process dialog. The dialog shows the list of processes running on the machine. The user selects the program that he/she wish to debug. OMEdit debugger attaches to the process.
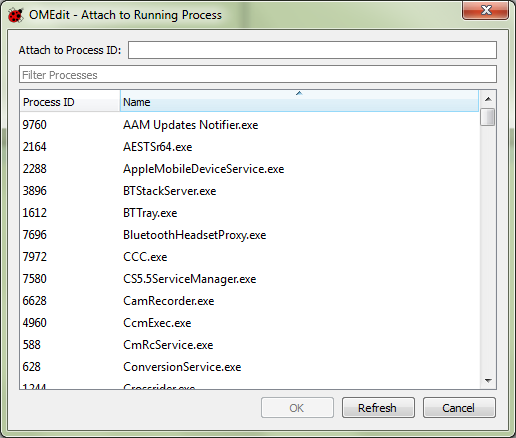
Figure 24 Attach to Running Process.
Using the Algorithmic Debugger Window
Figure 25 shows the Algorithmic Debugger window. The window contains the following browsers,
- Stack Frames Browser – shows the list of frames. It contains the
program context buttons like resume, interrupt, exit, step over, step in, step return. It also contains a threads drop down which allows switching between different threads.
- BreakPoints Browser – shows the list of breakpoints. Allows
adding/editing/removing breakpoints.
- Locals Browser – Shows the list of local variables with values.
Select the variable and the value will be shown in the bottom right window. This is just for convenience because some variables might have long values.
- Debugger CLI – shows the commands sent to gdb and their responses.
This is for advanced users who want to have more control of the debugger. It allows sending commands to gdb.
Output Browser – shows the output of the debugged executable.
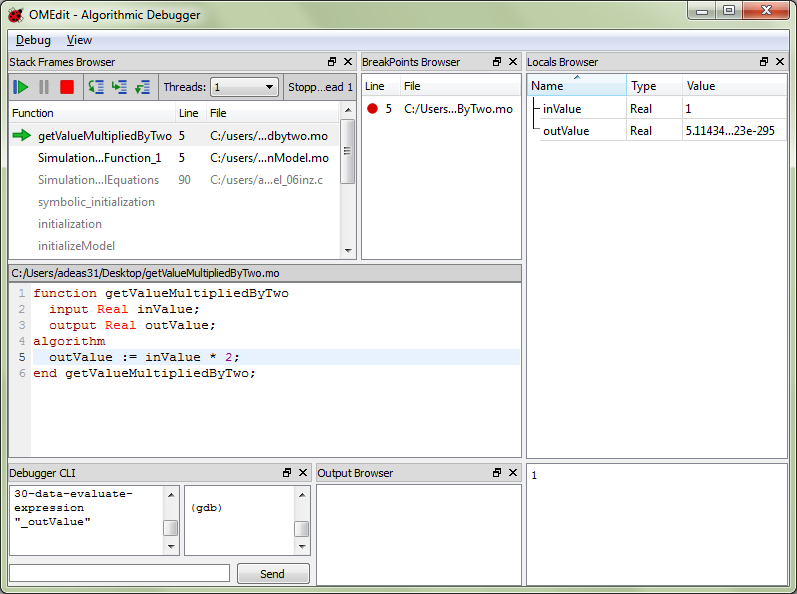
Figure 25 Algorithmic Debugger.