functioninitialResponse
Initial condition response plot of a discrete zeros-and-poles transfer function
Extends from Modelica_LinearSystems2.Internal.PartialPlotFunction (Interface of a plot function).
Information
Syntax
DiscreteZerosAndPoles.Plot.initialResponse(zp)
   or
DiscreteZerosAndPoles.Plot.initialResponse(
  zp,
  tSpan,
  y0,
  columnLabels,
  defaultDiagram=Modelica_LinearSystems2.Internal.DefaultDiagramTimeResponse(),
  device=Modelica_LinearSystems2.Utilities.Plot.Records.Device())
Description
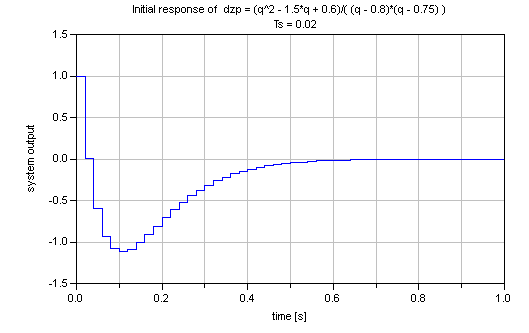
This function plots the initial response, i.e. the zeros input response of a zeros and poles transfer function. It is based on timeResponse.
Example
  DiscreteZerosAndPoles q = Modelica_LinearSystems2.DiscreteZerosAndPoles.q();
  Modelica_LinearSystems2.DiscreteZerosAndPoles dzp=(q^2 - 1.5*q + 0.6)/( (q - 0.8)*(q - 0.75) )
  Real y0=1;
  dzp.Ts = 0.02;

  Modelica_LinearSystems2.DiscreteZerosAndPoles.Plot.initialResponseZP(dzp, y0=y0, tSpan=1)
  // gives:
See also
Inputs
| Type | Name | Default | Description |
|---|---|---|---|
| Modelica_LinearSystems2.DiscreteZerosAndPoles | dzp | ||
| Real | tSpan | 0 | Simulation time span [s] |
| Modelica_LinearSystems2.Utilities.Types.TimeResponse | response | Modelica_LinearSystems2.Utilities.Types.TimeResponse.Initial | type of time response |
| Real | y0 | Initial output (for initial condition plot) | |
| Plot.Records.Diagram | defaultDiagram (from PartialPlotFunction) | Default diagram layout | |
| Plot.Records.Device | device (from PartialPlotFunction) | Modelica_LinearSystems2.Utilities.Plot.Records.Device() | Properties of device where figure is shown |